
In the dynamic landscape of social media marketing, the ability to measure engagement
meaningfully is more critical than ever. For brands operating in India, leveraging LinkedIn
Analytics India insights combined with the latest engagement metrics for 2025 can unlock
measurable success. This article walks you through the key metrics—beyond vanity numbers—to help
you focus on what truly matters: overall engagement, conversion rate, retention rate, and
long-term user experience.
Analytics are only valuable when they refine your strategy, improve user experience, and deliver business goals. On the B2B-driven platform LinkedIn, analytics reveal how your content resonates, how your followers behave, and whether your messaging drives action. In India, where professional networking and business growth go hand-in-hand, LinkedIn Analytics India provides crucial data on demographics, content performance, and feature adoption rate.
Globally, LinkedIn has over one billion users across 200 countries/regions (Semrush). In the Indian context, while exact user numbers aren’t always publicly broken down, India remains one of LinkedIn’s fastest-growing markets (The Economic Times).
For marketers, tracking daily active users, the number of users engaging, feature adoption rate (e.g., document posts, videos), and conversion metrics is critical to turning a social-media metric into a real business impact. Whether you work independently or through a LinkedIn marketing agency, these KPIs help connect campaign data to tangible ROI.
Earlier, brands relied on basic counts—likes, followers, impressions—as success indicators. These are vanity metrics: easy to track but poor at revealing true engagement. In contrast, engagement metrics 2025 emphasise deeper indicators such as comment rate, save rate, click-throughs, and conversions.
Multi-image posts on LinkedIn now average an engagement rate of 6.60% in 2025 (Socialinsider).
Video posts and native documents achieve 5.60% and 6.10% engagement, respectively (Socialinsider).
A healthy benchmark engagement rate is around 5%, with anything above 6 % considered excellent (Socinator).
These figures reflect evolving algorithms and user behaviour. Brands must therefore monitor rate measures—conversion rate, retention rate, and feature adoption—instead of just impressions or follower growth.
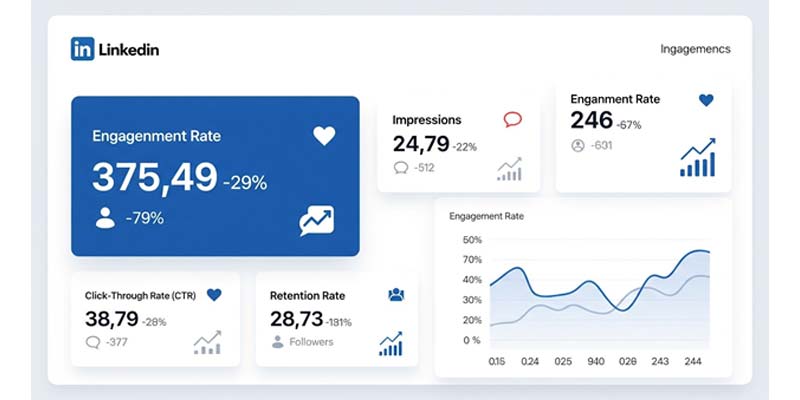
This measures total interactions (likes, comments, shares, clicks) divided by impressions or followers. It’s one of the strongest customer-engagement metrics, revealing whether content truly resonates.
Impressions show reach; profile visits show intent. Increased visits often indicate improved user experience and content relevance.
Follower count remains useful as a medium-term metric. A spike in followers with low interaction may suggest a high bounce rate, meaning users follow but don’t engage.
CTR and conversion rates connect engagement to outcomes such as lead forms or downloads. These go beyond interaction—they measure how your LinkedIn funnel drives actual business.
Retention rate reveals how consistently users engage with your page over time—an indicator of long-term brand relevance.
Track how each format performs:
Compare your data with competitors' or platform averages. In 2025, pages with 1,000 + followers show faster engagement growth (Metricool).

When creating a LinkedIn Content Strategy for a B2B business, localisation is key.
Including LinkedIn marketing tips, such as experimenting with A/B testing, post timing, and audience segmentation, can further refine performance tracking.
Likes + followers + impressions ≠ success. Low daily activity despite high followers signals poor relevance or targeting.
Many views but few clicks or profile visits? Reassess content quality and call-to-action placement.
Benchmarks differ by industry: 5% is good overall, but niche B2B verticals may demand higher rates (Socinator).
Use real-time monitoring to adjust content quickly, but prioritise long-term growth in retention, feature adoption, and conversions.
For Indian brands, measure conversion quality—like distributor or partner leads—not just engagement counts. Tracking ROI and retention gives a truer view of marketing success.
If you want to expand brand exposure, exploring LinkedIn hacks for brand visibility—like using thought-leadership carousels, employee advocacy, and newsletters—can enhance discoverability while improving engagement metrics.

Tracking the right KPIs through LinkedIn Analytics India and understanding engagement metrics in 2025 enables brands to focus on meaningful results. Measure smartly—engagement rate, conversion rate, retention rate, and feature adoption rate—and align them with your brand’s goals and audience behavior.
In the long run, a strong analytics-driven strategy improves user experience, deepens engagement, and drives measurable ROI. Whether through internal teams or a professional LinkedIn marketing agency, consistent data analysis is what turns insights into growth.