
In the web performance realm, tracking user interactions with your website becomes paramount in ensuring a better experience and perhaps conversions. Microsoft Clarity is a free, strong counterpart to Google Analytics; in the hands of the website owner, it goes much deeper into interpreting user behavior through heatmaps, session recordings, and performance monitoring. In this blog, we detail the usage of Microsoft Clarity for extensive web analytics and heatmaps, and optimize your site from there.
Microsoft Clarity is a free analytics tool intended to provide website owners and marketers with a better understanding of how visitors interact with their websites. It gives detailed insights into user behavior, including the following:
Heat maps show where users click, scroll, and move their mouse.
Session recordings of real-time user session replay.
User insights to track engagement and barriers to conversion.
To get started with Clarity, go to the Microsoft Clarity website and register a free account using either Microsoft, Google, or another account listed there. Once logged in, you will have to make a project by entering your website URL and a project name.
After creating a project, Clarity will give you a tracking code. You will need to add that code somewhere in the HTML of your website, just before the closing `` tag. That code collects the interaction data of users on your site.
WordPress: Use a plugin like "Insert Headers and Footers" or paste this code manually into your theme's header file.
Custom Websites: Paste it in the "head" section of your site.
Once installed, Clarity will begin tracking user activity on the site.
Microsoft Clarity comes with a bunch of nifty tools that help you in understanding user behavior in-depth. Let's take a look at some of the key features that you should explore:

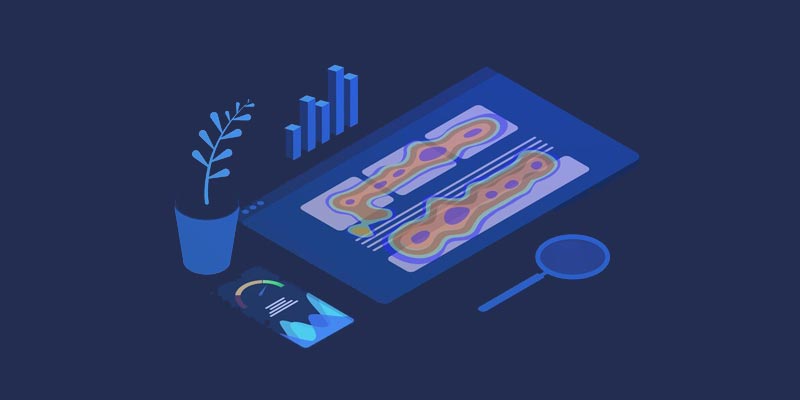
Heatmaps are a nice way to experience visual representations of user interactions on your website. Clarity provides three types of heatmaps:
The click heatmap shows where users are clicking on your page. It helps you identify popular areas (like buttons and links) as well as detect areas where users are mistakenly trying to click on non-interactive objects. Understanding where clicks are happening will help you design pages for better usability.
That is what the heat map shows: those decreases and how far users scroll down the page. Showing mainly whether users engage with the content positioned below the fold. A vast percentage of visitors may not reach the critical areas of the page, which will require the layout to be modified or some key content to be made more visible.
The heat map tracks the movement of the mouse and helps understand what places the visitors are concentrating on. Might indicate a stiffly distracting area or might need more focused attention. For example, if users hover around a particular section but do not click, it indicates that the design is unclear or ineffective.
With session recordings, you can create new real-time videos of visitors interacting with your site. This helps in understanding the user context in a lot of ways. When viewing the session replay, you can:
1. Identify points of friction, like the user being stuck or abandoning the page.
2. View the user flow through different pages, improving these using that data.
3. Check if users complete their actions, such as filling in forms or making purchases.
Session recordings can be filtered into many categories based on many different factors, such as device type (desktop, mobile, tablet), traffic source, geography, duration of the session, etc., enabling you to go deeper into the individual user's group.
Microsoft Clarity can give a range of user insights found mainly in the engagement metrics of clicks, scroll depth, and average time spent on the site. Use it to:
Identify which pages have the highest engagement and which might need improving.
Determine how many people perform the action that you are trying to get users to do (form submission, product purchasing).
Identify some interesting trends in user behavior, like "I go, I visit a page, and then I leave." ORM stands for Observer-Reactor Methodology.
In addition, clarity gives insight into your site performance based on user experience. It monitors important indicators such as load times and page performances that can be analyzed to find technical issues that may affect user engagement. This logging metric would also not let the users bounce due to loading speed.
Data collected from the heatmaps, session recordings, and insights from Clarity is now ready for analysis and action. Here's how you can use it to maximize a website:
The click heatmap can tell viewers if they are trying to click on non-clickable (like an image or text) elements. This might indicate design-related aspects that need improvement. For instance, users might generally expect a logo to link to the homepage when clicked. If it doesn't do that while letting users see the homepage logo, it is time to make it interactive.
Also, if the users have problems identifying your navigation bar or menu, perhaps it is time to move it or present it better.
The scroll heat map shows how deep users scroll down your pages. If a large part of visitors are not scrolling to view relevant content or your call-to-action (CTA) from the current point on the page, that content should be moved higher or divided into smaller sections for better engagement.
Users, in this case, are not scrolling far enough along the load line to see important content or your call to action. Additionally, heavy indicates the need to possibly restructure or layout the page.
The behavior of a mobile user while accessing a website is entirely different than that of a desktop user. Reviewing session recordings and analyzing heatmaps of mobile visitors might give insights like:
Buttons are overly small or disallowed for touch.
Contents not optimized for the smaller screen.
Navigation issues, where menus prove difficult to access or tough to use.
All these optimization processes ensure that your site is accessible to your clients on all their devices.
Session recordings can be a great help in indicating the possible conversion barriers. For instance, if users are seen to stop filling out a form in the middle or keep clicking on elements that don't work, now you know where to put your attention. You should also try to spot any confusion rampant throughout the user journey; if visitors are seen to hesitate or make mistakes at points (e.g., during checkout), those points would need to be simplified.
Sessions are a good avenue for assessing what frustrates users. You might very well see that users are repeatedly clicking on the wrong buttons or struggling to find a particular feature for too long. Addressing these friction points is thought to encourage measurable gains in user satisfaction and conversion rates.

Although Microsoft Clarity gives valuable insights, correlating it with other analytical tools can represent an extra layer of analysis. Some considerations for Clarity integration include:
Use Google Analytics to observe finer details, such as user demographics, traffic source, and conversions, while Clarity explains how users navigate through your website and react to your content.
Use these to conduct direct testing comparing two different page layouts and designs, then, with the help of Clarity heatmaps and session recordings, see which performs better.
Although Clarity has similar features, tools like Hotjar can be used in conjunction to get richer behavioral analytics as well as feedback from users.
Microsoft Clarity might not have the most advanced reporting options among some of the paid tools, but it allows heatmap and session recording exports in CSV format and image downloads. These exports can provide the basis for further analysis or be shared among team members so they can make informed decisions.
Microsoft Clarity is an extremely strong tool; it is free and does more than you think. It gives insight into how users interact with your site with heatmaps, session recordings, and user insights. It helps find the points of friction in designing your website to help alleviate those frictions, and, most importantly, create a better user experience. Whatever you optimize concerning conversions, engagement, or site performance, there's data on Clarity to support your decision. Then sprinkle it with incredible analytics, and you turn the user's behavior into a roadmap for a better-performing, more fulfilling website experience. Happy Optimizing! If you require help boosting your website and reaching the right audience, Bud, an SEO agency in Bangalore and a PPC agency in Bangalore, can help you find the right strategies to build your website. Bud is also a performance marketing agency in Bangalore that can help enhance your digital presence.